
In the ever-evolving world of data analytics, time series analysis remains a cornerstone for understanding patterns, trends, and behaviours over time. Among the various components that time series data exhibit, seasonality is particularly significant. Seasonality refers to repeating patterns or cycles that occur at regular intervals — daily, weekly, monthly, or yearly. While some seasonal patterns are apparent and easily detected, others are subtle or hidden within complex data, making their detection a challenging task.
This blog will delve into detecting hidden seasonality in complex time series and why mastering this skill is crucial for analysts. Whether you are a beginner or an advanced professional, understanding these concepts can enhance your analytical toolkit. If you are interested in sharpening these skills, consider enrolling in a data analyst course in Pune, which offers practical insights and hands-on training in advanced time series techniques.
What is Seasonality in Time Series?
Seasonality is a systematic, calendar-related pattern in time series data. For example, retail sales often increase during the holiday season every year, electricity consumption may peak during summer months, and website traffic might show weekly patterns depending on user behaviour.
Seasonality helps forecast future values by leveraging these recurring patterns. However, when seasonality is hidden or obscured by noise, irregular fluctuations, or multiple overlapping cycles, traditional detection methods may fail to reveal it. This is especially true for complex time series data characterised by:
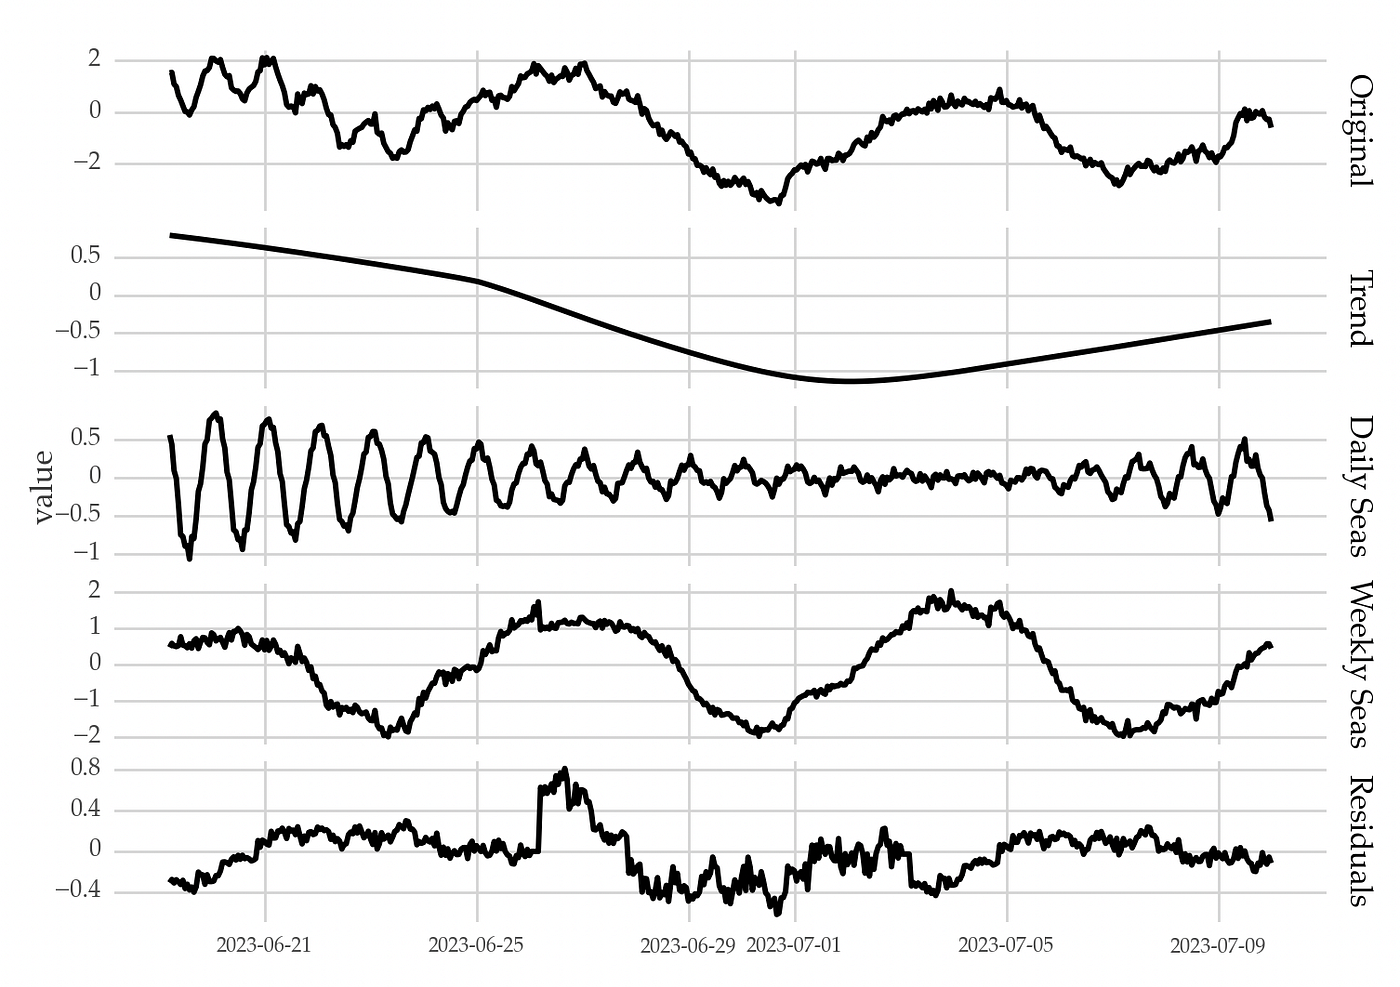
- Multiple seasonal cycles (e.g., daily and weekly patterns simultaneously)
- Nonlinear or changing seasonal effects
- Irregular time intervals or missing data
- Noisy data with high volatility
Why Detecting Hidden Seasonality Matters?
Understanding seasonality is vital because it:
- Improves forecasting accuracy by accounting for cyclical effects.
- Helps businesses identify peak periods and optimise inventory, staffing, or marketing.
- Reveals behavioural insights across industries such as finance, healthcare, and climate science.
- Enables better anomaly detection by distinguishing expected seasonal changes from true outliers.
If hidden seasonality is not identified and modelled, forecasts can be biased or misleading, which in turn impacts decision-making.
Challenges in Detecting Hidden Seasonality
Detecting seasonality becomes complicated when:
- Multiple Seasonal Patterns Exist: Some data series have more than one seasonal cycle — for example, electricity demand may have daily, weekly, and yearly cycles. These overlapping seasonalities make decomposition more complicated.
- Seasonal Patterns Change Over Time: Seasonality may not be stationary. For instance, shopping behaviour during holidays may evolve yearly, or weather patterns may shift, changing energy consumption trends.
- Noise and Irregularities: High volatility or outliers can mask seasonal patterns.
- Irregular or Sparse Sampling: Missing data points or irregular intervals complicate traditional decomposition methods like classical STL (Seasonal-Trend decomposition using Loess).
Techniques to Detect Hidden Seasonality
1. Classical Decomposition Methods
- Additive and Multiplicative Decomposition: The time series is split into trend, seasonal, and residual components. This works well for simple seasonal patterns but struggles with complex seasonality.
- STL (Seasonal and Trend decomposition using Loess): An advanced smoothing technique that is robust and flexible for many seasonal patterns, but may need adjustments for multiple seasonality.
2. Fourier and Spectral Analysis
Fourier transforms convert time series data into the frequency domain, helping detect repeating cycles as peaks in the frequency spectrum. It is effective for identifying hidden cycles but may not handle non-stationary seasonality well.
3. Autocorrelation and Partial Autocorrelation
Autocorrelation plots measure the correlation of a time series with its own lagged values. Significant spikes at specific lags indicate potential seasonality. This method is simple but may not reveal complex multiple seasonalities.
4. Machine Learning and Deep Learning Approaches
With advances in AI, techniques like Long Short-Term Memory (LSTM) networks and Convolutional Neural Networks (CNNs) can learn complex temporal dependencies and uncover hidden seasonalities without explicitly decomposing the time series.
5. Time Series Decomposition with Multiple Seasonalities: TBATS and Prophet
- TBATS (Trigonometric, Box-Cox transform, ARMA errors, Trend, and Seasonal components): This model can handle multiple and non-integer seasonality periods effectively.
- Facebook Prophet: An open-source forecasting tool that models multiple seasonal effects and changes over time, with user-friendly implementation.
6. Wavelet Transforms
Wavelets analyse time series data at different scales, capturing both frequency and time information. This makes them ideal for detecting seasonal patterns that evolve.
Practical Steps to Detect Hidden Seasonality
- Visualise the Data: Plot your time series and use seasonal subseries plots or heatmaps to identify apparent patterns.
- Check Autocorrelation: Use ACF and PACF plots to spot repeating lags indicative of seasonality.
- Perform Frequency Analysis: Apply Fourier or wavelet transforms to detect periodicities.
- Decompose the Series: Use STL, TBATS, or Prophet to extract seasonal components and assess their significance.
- Validate with Domain Knowledge: Confirm whether detected seasonal patterns align with real-world cycles or events.
- Use Robust Forecasting Models: Incorporate detected seasonality into forecasting models and compare performance with models that exclude seasonality.
Real-World Examples of Hidden Seasonality Detection
- Retail Sales: Multiple seasonalities from daily sales cycles and annual holiday effects may coexist. Using TBATS or Prophet models helps retailers optimise inventory and promotions.
- Energy Demand Forecasting: Electricity consumption often shows daily, weekly, and seasonal cycles, with occasional changes due to weather or policy. Wavelet transforms combined with machine learning models capture these complex patterns.
- Healthcare Monitoring: Hospital admission rates might have hidden weekly or monthly cycles influenced by external factors like weather or epidemics.
Tools and Libraries for Seasonality Detection
- Python: statsmodels (seasonal_decompose, STL), Prophet, tbats, scipy (Fourier transforms), PyWavelets.
- R: forecast package (tbats, stl), prophet, wavelets.
- Visualisation: matplotlib, seaborn for plotting time series and autocorrelation.
Why Learning to Detect Seasonality is Essential for Data Analysts?
Detecting seasonality, especially hidden patterns, is a critical skill for any data analyst working with time series data. Understanding these patterns leads to better forecasting, more intelligent business decisions, and more insightful analyses.
Suppose you’re aiming to become proficient in this area. In that case, a data analyst course in Pune can provide you with the theoretical knowledge and practical experience necessary to master seasonality detection techniques. Such courses often cover time series decomposition, Fourier analysis, machine learning approaches, and real-world case studies.
In the middle of your learning journey, integrating hands-on projects related to complex time series helps consolidate your knowledge. This exposure not only boosts your confidence but also makes you industry-ready with practical skills that employers highly value.
Moreover, a comprehensive data analyst course equips you with a variety of tools and programming skills—ranging from Python and R libraries to visualisation techniques—making you adept at handling real-world time series problems involving hidden seasonality.
Conclusion
Detecting hidden seasonality in complex time series is both an art and a science. While traditional decomposition methods work well for simple seasonal patterns, advanced techniques like TBATS, Prophet, wavelet transforms, and machine learning models are essential for uncovering subtle or multiple seasonal cycles in noisy, irregular, or evolving data.
Recognising and modelling these hidden patterns significantly enhances forecasting accuracy, optimises resource allocation, and unveils actionable insights across industries. Whether you are a business analyst, data scientist, or aspiring data professional, honing this skill is invaluable.
If you are serious about elevating your expertise in time series analysis, consider enrolling in a data analyst course that offers in-depth training on seasonality detection and other critical analytical techniques. The knowledge and skills you gain will empower you to extract meaningful insights from even the most complex time series data.
Business Name: ExcelR – Data Science, Data Analytics Course Training in Pune
Address: 101 A ,1st Floor, Siddh Icon, Baner Rd, opposite Lane To Royal Enfield Showroom, beside Asian Box Restaurant, Baner, Pune, Maharashtra 411045
Phone Number: 098809 13504
Email Id: enquiry@excelr.com